How To create performance reports |
This article describes how to generate performance reports using Packflow built-in benchmarking features.
Performance reports are a very efficient tool to help you diagnose performance issues occuring during specific scenarios.
Performance reports can be created at any time clicking Start from the Performance section of the Administration interface.
Packflow records every interesting operations occuring during the performance test and keeps track of their duration.
During the performance test, make sure to reproduce the operations that you suspect to cause performance issues. When you consider that enough data has been collected, click Stop and open the report by clicking on Open.
Packflow performance reports are displayed as trees. Root nodes represents application entry points such as page requests or SignalR calls while deeper nodes will give you details about lower-level operations such as database queries.
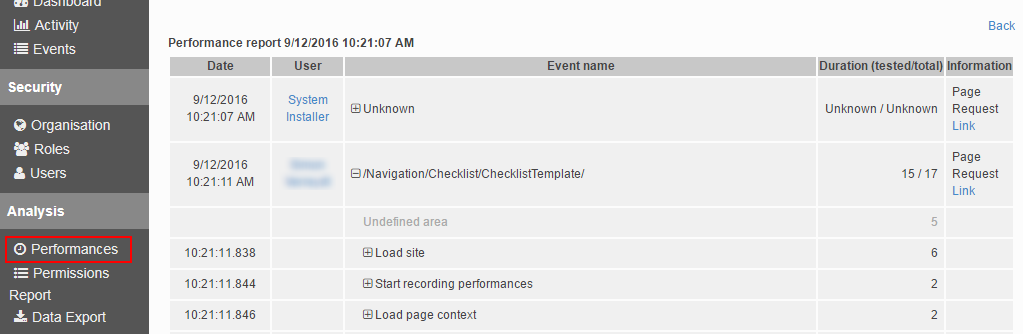
The Duration (tested/total) column gives you the total amount of time (in milliseconds) the node took to be executed vs. the total time (including the overhead caused by performance measuring).
The Information column gives you more contextual information (e.g. the exact SQL query that was executed or the URL that was requested).
The method RunCodeInPerformanceArea(String, PerformanceAreaCode, Boolean) lets you to do define precise areas of your code that will appear in a dedicated node inside the performance report.
It takes a name (the name that will appear in the Event name column) and a delegate to be executed.
This method guarantees you that the delegate passed as paramater will be executed even if a performance test is not currently running. It also adds almost no performance overhead since it will simply call the delegate you passed as parameter. Consequently, you shouldn't hesitate to use this method in a production environment. It will help you to quickly identify the causes of performance bottlenecks in your application without the need for a redeployment.
This example shows how to define a custom performance area from an item controller. Custom performance areas can of course be defined anywhere in your code as long as you have access to a PFSite instance.
public class MyItemController : PFItemController<MyItem>
{
    public override ActionResult SaveItem(MyItem item, FormCollection collection)
    {
        item.Site.RunInPerformanceArea("My long computation", counter =>
        {
            // the counter parameter will be null if a performance test is not currently running.
            if (counter != null)
                counter.Description = "Some contextual information"; // optional

            // Potentially long running code here.
        }
        return base.SaveItem(item, collection);
    }
}
Calls to this method can be nested. In that case nested calls will appear as descendants nodes in the report tree. |